Cross-species Homologous Regulatory Analysis#
Batch correction#
The data of CS13 human embryo can be downloaded from https://heoa.shinyapps.io/code/, and E10.5 mouse embryo can be downloaded from https://db.cngb.org/stomics/mosta/. The datas were preprocessed through basic format conversion to enable storage and access in the h5ad format.
[1]:
import scanpy as sc
import matplotlib.pyplot as plt
import HieDiff as hd
import pandas as pd
import re
from arboreto.utils import load_tf_names
import anndata as ad
import numpy as np
[2]:
def adata_split(adata, batch_key_list, batch_key="batch"):
    adata_list = []
    for i in batch_key_list:
        print(i)
        index=np.flatnonzero(adata.obs[batch_key]==str(i))
        adata_list.append(adata[index,])
    return adata_list
[5]:
human = sc.read_h5ad('E:/Human_Mouse_Embryonic/Human_S1.h5ad')
human.obs['species'] = 'human'
human.obs['annotation'] = 'Unknow'
mouse = sc.read_h5ad('E:/Human_Mouse_Embryonic/Mouse_E10.5_E2S1.h5ad')
mouse.X = mouse.layers['count']
mouse.obs['species'] = 'mouse'
[6]:
adata = ad.concat([human,mouse])
adata
[6]:
AnnData object with n_obs × n_vars = 11403 × 15131
    obs: 'species', 'annotation'
    obsm: 'spatial'
[7]:
adata = ad.concat([human,mouse])
sc.pp.highly_variable_genes(
    adata,
    n_top_genes=3000,
    subset=False,
    flavor="seurat_v3",
    batch_key="species",
    )
adata = adata[:, adata.var['highly_variable']]
[8]:
hd.spatial_reconstruction(adata, normalize_total=True, n_neighbors=3, alpha=0.5)
[9]:
hd.run_HieDiff(adata, n_epochs=5000, n_hidden=256, n_latent=48,device='cuda',batch_key='species')
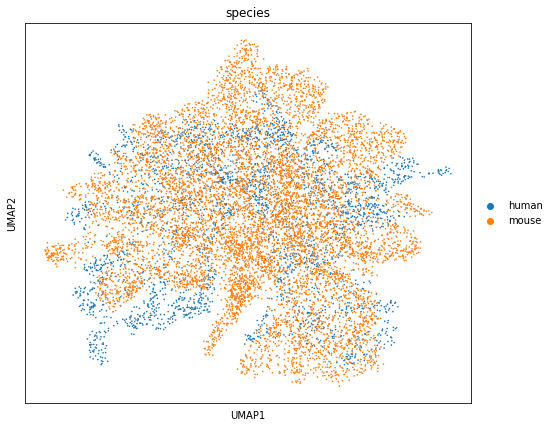
[12]:
sc.pp.neighbors(adata,use_rep='qz')
sc.tl.umap(adata,min_dist=1)
fig, axs = plt.subplots(figsize=(8, 7))
sc.pl.umap(adata, color=['species'],ax=axs)
E:\Anaconda\envs\sparcl\lib\site-packages\scanpy\plotting\_tools\scatterplots.py:392: UserWarning: No data for colormapping provided via 'c'. Parameters 'cmap' will be ignored
  cax = scatter(
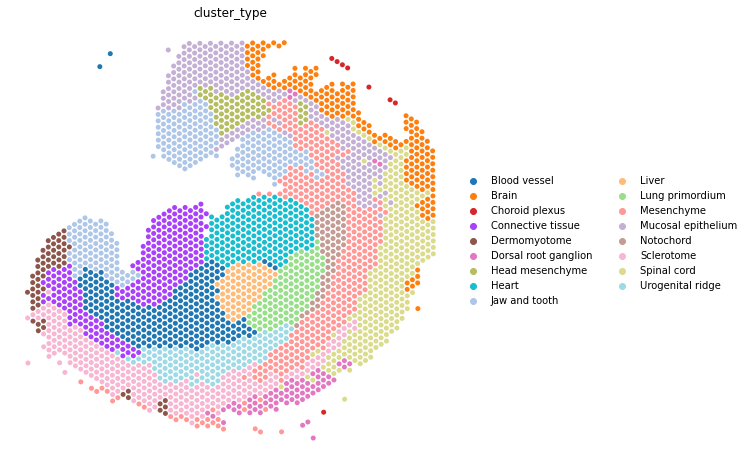
Co-clustering#
We performed co-clustering in the shared low-dimensional space obtained after batch correction and annotated the resulting clusters based on prior biological knowledge.
[13]:
sc.pp.neighbors(adata,use_rep='qz')
sc.tl.leiden(adata,resolution=3)
adata_list = adata_split(adata=adata, batch_key_list=['human','mouse'],batch_key='species')
human
mouse
[14]:
def calCelltype(df, cluster_key="leiden"):
    cluster_index=list(df[cluster_key].value_counts().index)
    annot = dict()
    df['cluster_type']="None"
    for cluster in cluster_index:
        type_index=list(df[df[cluster_key]==cluster]["annotation"].value_counts().index)
        cell_type=type_index[0]
        # print(type_index)
        annot[str(cluster)] = cell_type
        # df.loc[df[cluster_key]==cluster,['cluster_type']]=cell_type
    return annot
[16]:
mouse_annot = calCelltype(adata_list[1].obs, cluster_key="leiden")
[17]:
adata_list[1].obs["cluster_type"] = [mouse_annot[str(i)] for i in list(adata_list[1].obs["leiden"])]
[20]:
human_annot=pd.read_csv('E:/Human_Mouse_Embryonic/human_annot.csv')
[22]:
adata_list[0].obs['cluster_type'] = adata_list[0].obs['leiden'].map(human_annot).astype('category')
fig,axs = plt.subplots(figsize=(8, 8))
sc.pl.embedding(
    adata_list[0],
    basis= 'spatial',
    frameon=False,
    size=100,
    color=['cluster_type'],
    show=False,
    ax=axs
)
E:\Anaconda\envs\sparcl\lib\site-packages\scanpy\plotting\_tools\scatterplots.py:392: UserWarning: No data for colormapping provided via 'c'. Parameters 'cmap' will be ignored
  cax = scatter(
[22]:
<AxesSubplot: title={'center': 'cluster_type'}, xlabel='spatial1', ylabel='spatial2'>
Regulatory network inference#
Based on the inferred gene co-expression matrix W, we performed regulon inference and quantified the activity of each regulon across spatial locations.
[23]:
from yaml import Loader, Dumper
import glob
from typing import Optional, Sequence
from anndata import AnnData
from yaml import load, dump
try:
    from yaml import CLoader as Loader, CDumper as Dumper
except ImportError:
    from yaml import Loader, Dumper
from pyscenic.rnkdb import FeatherRankingDatabase as RankingDatabase
from pyscenic.utils import modules_from_adjacencies
from pyscenic.prune import prune2df, df2regulons
from pyscenic.aucell import aucell as pyscenic_aucell
[24]:
human_gene=list(adata_list[0].var_names)
human_gene=[s.upper() for s in human_gene]
adata_list[0].var_names = human_gene
[26]:
from yaml import Loader, Dumper
import glob
MOTIF_ANNOTATIONS_FNAME='E:/CisTarget/motifs-v9-nr.hgnc-m0.001-o0.0.tbl'
tf_names=np.array((pd.read_table('E:/CisTarget/hs_hgnc_tfs.txt',header=None).iloc[:,0]))
DATABASES_GLOB='E:/CisTarget/hg19-*.mc9nr.feather'
db_fnames = glob.glob(DATABASES_GLOB)
[27]:
hd.regulons(adata_list[0], tf_names, MOTIF_ANNOTATIONS_FNAME, db_fnames, neighbors_var_key='W')
hd.aucell(adata_list[0], normalize=True,auc_threshold=0.05)
[28]:
MOTIF_ANNOTATIONS_FNAME='E:/CisTarget/motifs-v9-nr.mgi-m0.001-o0.0.tbl'
tf_names=np.array((pd.read_table('E:/CisTarget/mm_mgi_tfs.txt',header=None).iloc[:,0]))
DATABASES_GLOB='E:/CisTarget/mm9-*.mc9nr.feather'
db_fnames = glob.glob(DATABASES_GLOB)
[29]:
hd.regulons(adata_list[1], tf_names, MOTIF_ANNOTATIONS_FNAME, db_fnames, neighbors_var_key='W')
hd.aucell(adata_list[1], normalize=True,auc_threshold=0.05)
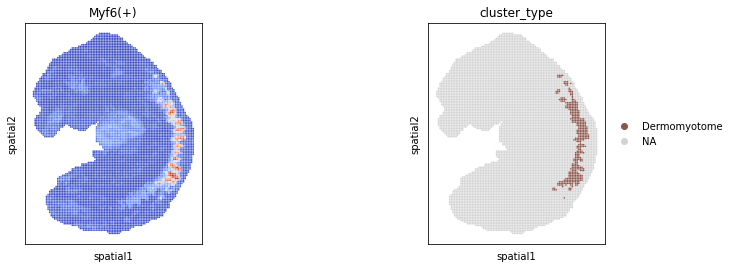
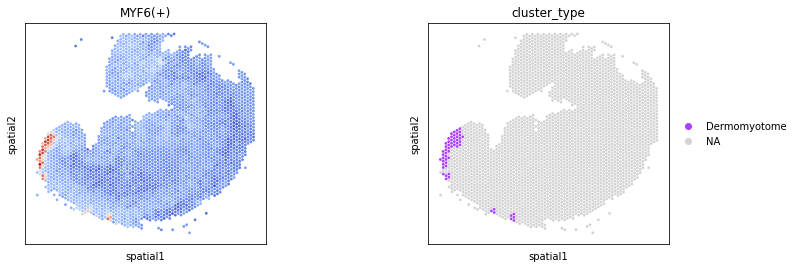
Visualization of spatial patterns of regulon activity#
We selected several homologous regulons with prior biological knowledge for spatial visualization.
[37]:
human_aucell = sc.AnnData(adata_list[0].obsm['aucell'])
human_aucell.obs = adata_list[0].obs.copy()
human_aucell.obsm = adata_list[0].obsm.copy()

mouse_aucell = sc.AnnData(adata_list[1].obsm['aucell'])
mouse_aucell.obs = adata_list[1].obs.copy()
mouse_aucell.obsm = adata_list[1].obsm.copy()
[38]:
spatial=pd.DataFrame(human_aucell.obsm['spatial'])
x=spatial[0]
y=spatial[1]

spatial[0]=x
spatial[1]=-y

human_aucell.obsm['X_spatial']=spatial.values
[45]:
sc.pl.spatial(
    human_aucell,
    basis='spatial',
    color=['MYF6(+)','cluster_type'],
    spot_size=100,
    groups=['Dermomyotome'],
    colorbar_loc=None,
    legend_loc='right margin',
    show=False,
    cmap='coolwarm'
)
[45]:
[<AxesSubplot: title={'center': 'MYF6(+)'}, xlabel='spatial1', ylabel='spatial2'>,
 <AxesSubplot: title={'center': 'cluster_type'}, xlabel='spatial1', ylabel='spatial2'>]
[51]:
sc.pl.spatial(
    mouse_aucell,
    basis='spatial',
    color=['Myf6(+)','cluster_type'],
    spot_size=1,
    groups=['Dermomyotome'],
    colorbar_loc=None,
    legend_loc='right margin',
    show=False,
    cmap='coolwarm'
)
[51]:
[<AxesSubplot: title={'center': 'Myf6(+)'}, xlabel='spatial1', ylabel='spatial2'>,
 <AxesSubplot: title={'center': 'cluster_type'}, xlabel='spatial1', ylabel='spatial2'>]